- Your cart is currently empty.
How to Test Your Website’s Speed and Load Time

You’ve bought web hosting, set up your website, chosen a graphic template and installed a plugin, two, … ten or more for some extra functionality. All well and good – the website is up and running, you’ve attracted your first visitors, maybe even made your first purchase if you’ve set up an online shop. But what about speed? Have you paid attention to it?
Speed on the web is extremely important. In recent years, many studies have been carried out to test the correlation between the speed of an online shop and the number of purchases made. For example, one of them found that a 1-second reduction in loading time for an online shop could result in 27% more purchases. Not a lot, don’t you think?
Google also puts a lot of emphasis on speed, as they have designed their search engine algorithm so that faster websites have a better chance of achieving high rankings. In addition, the quality of the user experience on a website influences its visibility on Google: the more visitors interact with it and the longer they stay on it, the more visible it will be on the search engine.
The fact is that people’s attention span is getting shorter every year. According to research by Microsoft, the average attention span today is only about 8 seconds. So with your website or shop, you only have 8 seconds to convince a visitor not to leave so quickly.
Slow loading is definitely one of the main causes of visitor frustration. Today, we’re not going to write about how to speed up your website, but rather how to test the speed of your website. This is the first step you need to take when you decide to optimise your website for speed.
Table of contents
1. Tools to test website speed
You can check the speed of your website using a number of online tools. Some of the most useful and popular tools are the ones we present below.
Whichever tool you use to test the speed of your website, we recommend that you run the test several times. The results can vary considerably, especially with PageSpeed Insights, so that you can use the average or more realistic loading times.
1.1 Chrome DevTools
If you use Google Chrome to browse the web, you can check the speed of your website using the built-in Chrome DevTools.
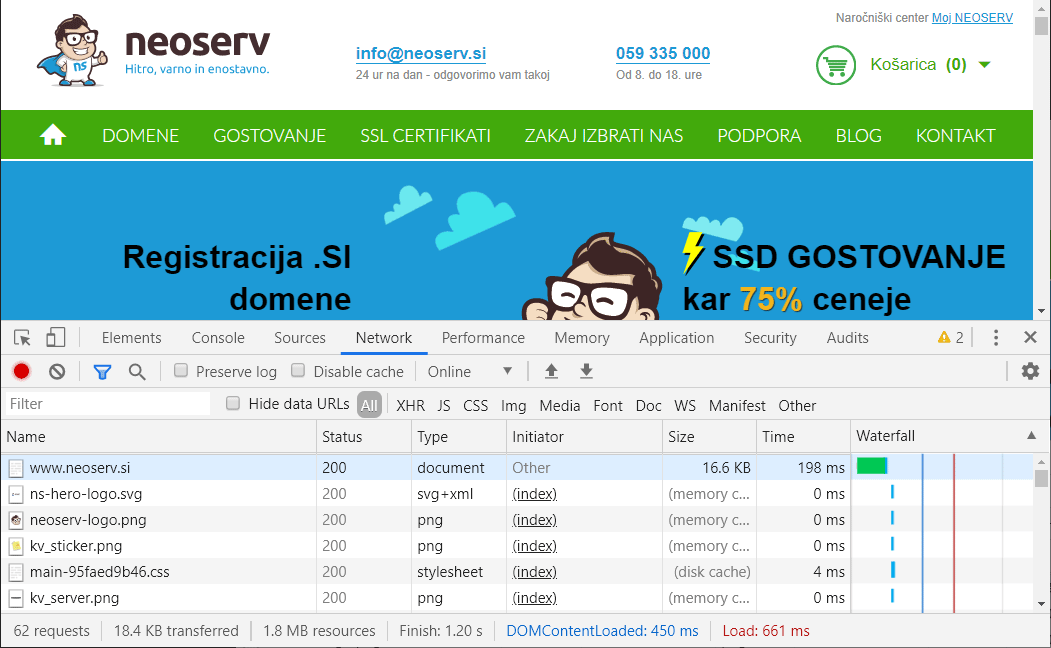
You can open it by pressing F12 on your keyboard or by right-clicking anywhere on the web page and selecting Inspect. Then select the Network tab and press CTRL+R or F5 on your keyboard to refresh the page.
As you can see in the screenshot above, Chrome DevTools gives you the details of each request. On the right-hand side you will also find an indication of how long each request is taking. The most interesting thing is the bottom row, in particular the total number of requests (bottom left) and the total page load time in red (bottom right).
1.2 Firefox Network Monitor
Are you more familiar with the Mozilla Firefox web browser? You can also use it to check the speed of a web page, using a process almost identical to that of Google Chrome.
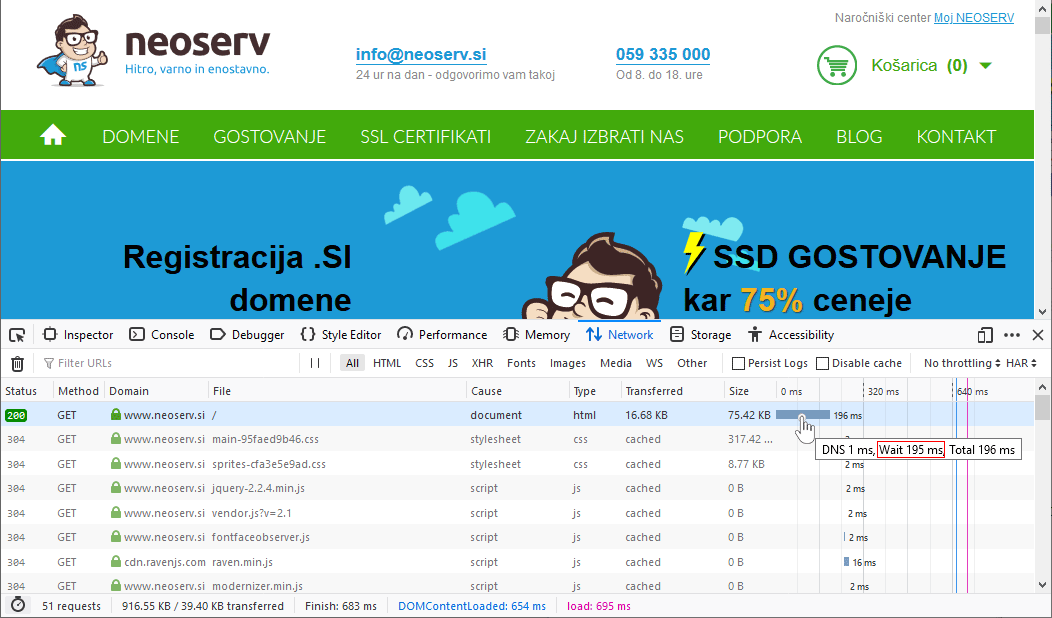
To open the Web Developer Tool, which includes speed tests, press F12. Alternatively, right-click (anywhere on the page) and then select Inspect Element (Q). Again, select Network and then refresh the page with CTRL+R or F5.
As for the interpretation of the results, again focus mainly on the bottom line. The most important is the total loading time, displayed in purple. Let us also mention here the first line in the list of requests, where the time to first byte – TTFB– is displayed on the right-hand side. More precisely, TTFB represents the “Wait” time, which can be found by hovering over the waterfall chart.
1.3 PageSpeed Insights
The PageSpeed Insights web tool is a product of Google developers. It helps you see how fast your website is on mobile and how fast it is on desktop.
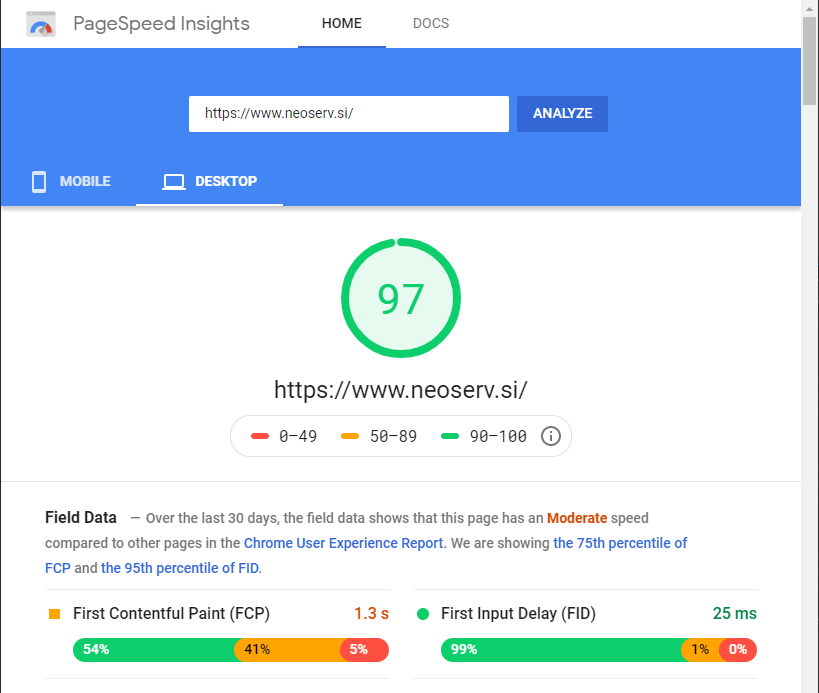
If you enter your website address in the box above and click on the ANALYZE button, the tool will check the speed of your website in just a few moments and give you an overall score from 0 to 100. The higher the number, the faster your website should be.
PageSpeed Insights analysis also includes additional details of individual times. Green indicates a fast website, orange indicates medium and red indicates slow.
Below the speed analysis, the tool will give you more details on what is slowing down your website. It also gives you tips on what you can do to make your website faster.
1.4 Pingdom Website Speed Test
Pingdom Website Speed Test is a great online tool for testing the speed of a website. You can take the test for free. You can currently choose from seven server locations where the test should be performed.
It is very important that you choose the location closest to your visitors’ location. If your website is aimed at visitors from Slovenia, it is best to choose Frankfurt (Germany).
Once you have entered the link to your website in the URL box and selected the appropriate location, all you have to do is click on the START TEST button. Then wait a few moments for the tool to perform the speed test.
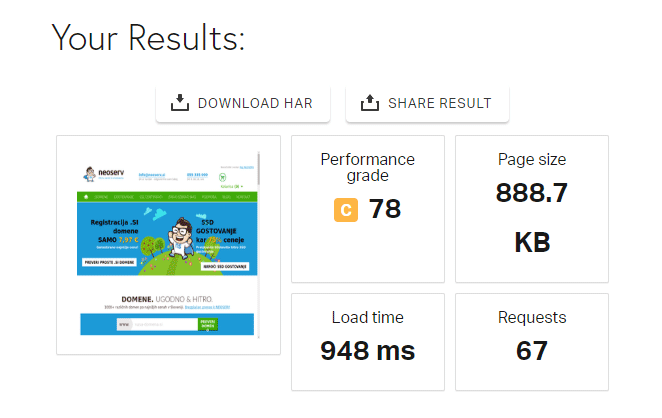
The basic test results include four pieces of information:
- Overall Performance Grade,
- the total page load time,
- Page size,
- the number of Requests.
Below the basic results, Pingdom Tools shows you the speed ratings for each group and suggests what you can do to speed up your website. Further down, there are four tables of data, namely:
- Content size by content type,
- number of requests by content type,
- content size by domain,
- number of requests per domain.
At the bottom of the speed test results, the requests for all files are also shown in a step chart, where you can see how long each request took.
1.5 GTmetrix
One of the most popular tools for testing the speed of a website is GTmetrix. It works in a similar way to Pingdom Tools, but you will need to register on the GTmetrix site first. This will allow you to run the test on a server that is closer to your website visitors.
So first, click on Sign Up in the top right corner, enter your details, confirm the terms of use and register. Confirm your account via the message you will receive in your email inbox immediately after registration.
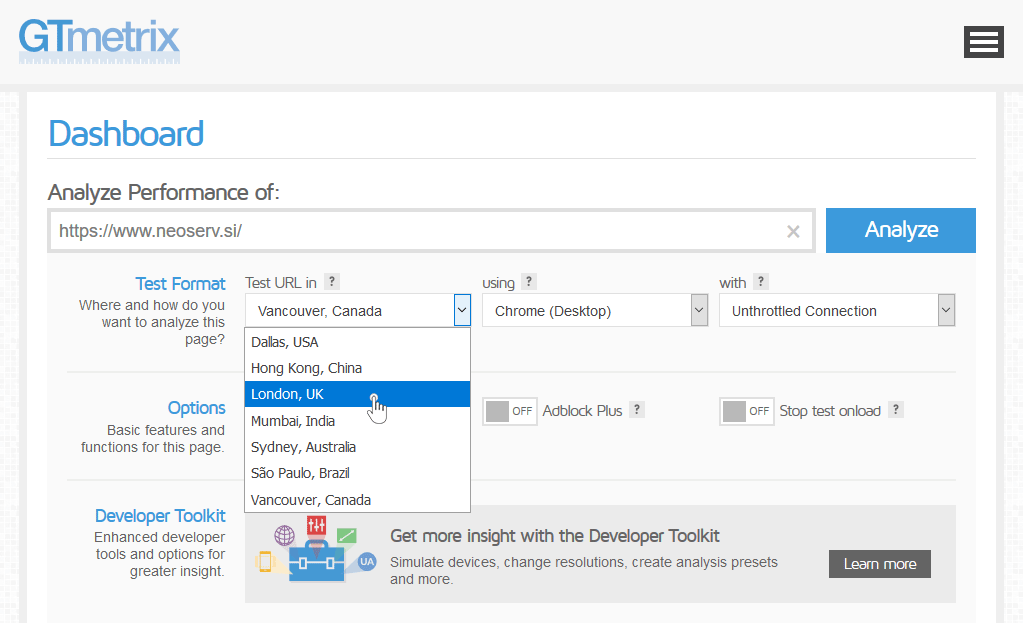
Before you run a speed test on your website, click on the Analysis Options box (under the blue Analyze button) and select the appropriate location. If your site is aimed at visitors from Slovenia, we recommend that you select London, UK. The other locations are in the USA, Asia and Australia, which means that tests conducted in these locations will show worse results.
As you can see in the picture above, GTmetrix offers you some additional settings. For example, you can choose the browser through which the test will be run and the type of connection. Once you have set the desired settings, enter the URL of your website in the box above, click on the Analyze button and wait a few seconds.
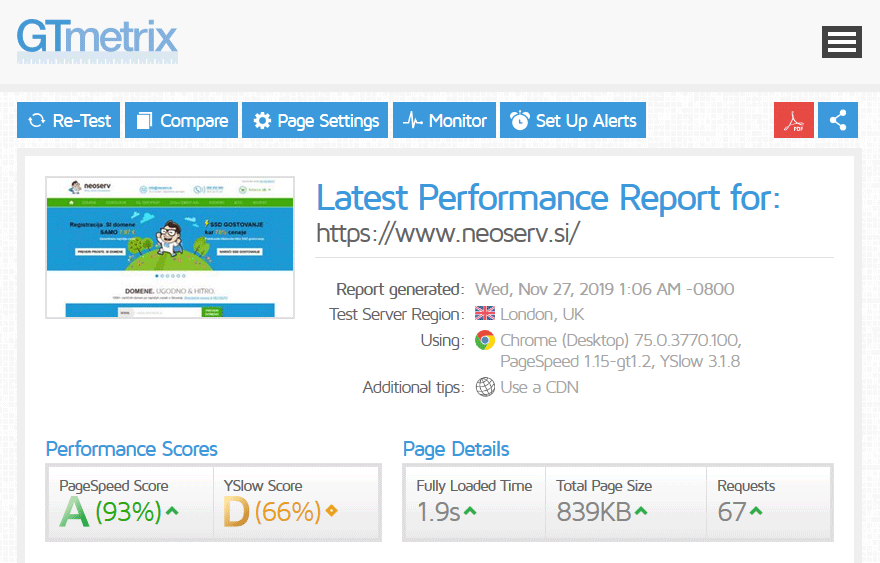
The results of the test will first include an overall speed rating (PageSpeed rating, YSlow rating) and some basic information about the analysed website (total load time, total page size, number of total requests).
There are some differences between the calculation of the PageSpeed (Google) and YSlow (Yahoo) scores. Each service analyses a web page using a set of rules that it considers to be the most important in terms of page speed and performance. Most of the rules overlap or are very similar to each other, but nevertheless the final scores are not necessarily the same. As you can see in the example above, the variance can be significant.
Below the basic results, you can see the details of the GTmetrix analysis, where each type of request is evaluated and suggestions are made on how to improve the speed further.
2. And now that I know how fast my website is?
Are you satisfied with the speed test results? Are the numbers low and mostly green? Then it’s best not to make any major changes to your website. But if the test results show that there’s still room for improvement, it’s definitely time to roll up your sleeves and start optimising.
Most website speed analysis tools will give you an explanation of each result and give you useful tips on how to speed up your website. The results are usually ranked in order of importance, meaning that you will get the most out of the actions that are highest on the list.
Before you start making changes, make sure you understand what each measure means. Although most of the recommendations for your website probably make sense and would actually help your site to work faster, not all of them would. These are general recommendations and best practices, but that doesn’t mean you have to follow them all.
For example: GTmetrix takes into account whether you use a CDN(Content Delivery Network) on your website when assessing YSlow. If you have a Slovenian-language website for domestic visitors, and you have a web hosting lease in Slovenia, you definitely don’t need a CDN. However, since you do not use a content delivery network, your YSlow score is significantly lower.
And of course, what is also extremely important, besides optimising the speed of the website itself, is the web hosting. At NEOSERV, we offer you affordable hosting on modern SSD servers, which are the perfect basis for lightning-fast website performance.
Powerful shared and reseller hosting packages are available, while TURBO packages are designed for the most demanding clients with large websites and high traffic. The latter boast the same or even better server performance than most VPS packages.
Whichever hosting package you choose, NEOSERV will provide you with friendly and professional support 24 hours a day, every day of the year. Plus, you’ll also enjoy a 90-day satisfaction guarantee!




COMMENT THE POST
Your comment has been successfully submitted
The comment will be visible on the page when our moderators approve it.